DevOps Automation
Over the last year I helped to embed and scale Force.com as an application platform at a large enterprise. I have shared in previous articles the value proposition, org strategy, standards, and the developer experience (focused on Continuous Integration).
This work transformed the way software was built, deployed and scaled across the enterprise, successfully reducing lead times from months to weeks, without sacrificing quality. However, our initial implementation still relied upon numerous “human checkpoints” and a fixed release schedule (weekly production releases).
This led to an initiative that we called “DevOps Automation”, with DevOps being the culture and automation being the focus of the work.
The goal of DevOps Automation was to improve time to business value, agility, security, and quality by automating the end-to-end development lifecycle (ideation to production). It would also aim to provide development teams complete autonomy, with no fixed release schedule (allowing them to release into production as often as required).
I’m pleased to report that after eight weeks of hard work, DevOps Automation went live and has already seen over 200 fully automated production releases since March.
This article will aim to summarise our DevOps Automation setup.
DevOps Automation Architecture
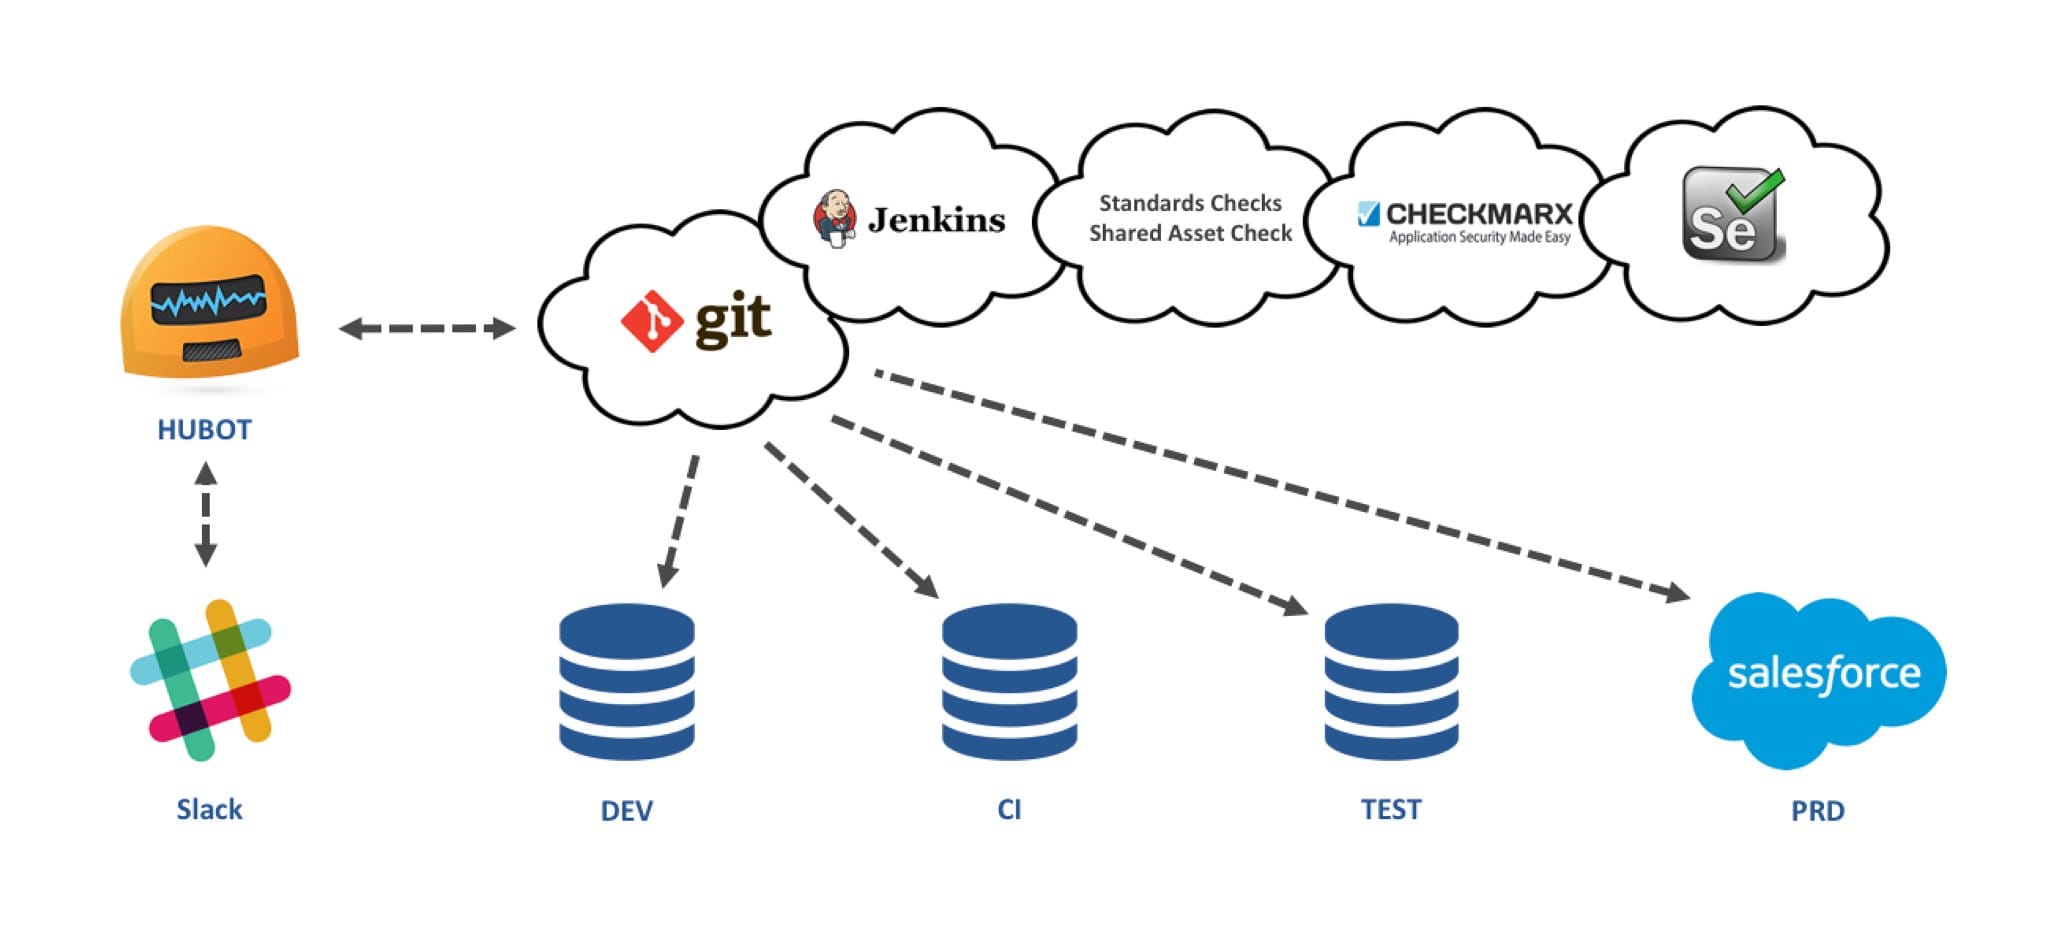
The following technical components were used to facilitate the DevOps Automation process. Many of these were reused from our existing Continuous Integration methodology, but with a renewed focus on end-to-end automation.
GitHub: Git is the primary interface for the development teams. It provides distributed version control, but also triggers the automation activities and code movement through updates to specific branches (usually via a Pull Request).
CloudBees: CloudBees is Jenkins-as-a-Service, which watches the Git repository and triggers the required automation action. We created Jenkins Job templates, which allow us to easily scale across any number of projects with minimal initial setup.
Standards Checks: A custom script (written in Java) that confirms the development team have complied with our Force.com Developer standards). There are approximately sixty standards checks in total, covering the security model, namespacing, limits, etc.
Shared Asset Check: A custom script (written in Java) that confirms that no shared assets (objects, classes, etc.) have been modified.
Checkmarx: Static Code Analysis that scans every line of code looking for potential security issues and/or vulnerabilities.
Selenium: Used for automated user interface testing and/or the execution of manual steps. The development team does not always require this capability, but it can help overcome some of the Force.com meta-data API limitations.
ALM Tool: A Force.com application lifecycle management tool (like the Agile Accelerator) that facilitates the development sprint. It is also used to capture the technical and business approvals.
Slack and HUBOT: The “single pane of glass” for developers, where they can trigger actions and receive real-time feedback regarding their development. All actions are triggered using natural language, via HUBOT (our friendly bot created by the team at GitHub, running on Heroku).
Developer Experience
Looking at the DevOps Automation architecture, it’s easy to think that this would be a complicated process. However, it’s important to note that the development teams only interact with GitHub, Slack and the ALM Tool. All other components are triggered via the automation.
Before describing the developer experience, it’s worth reiterating the environment setup that every development team receives.
DEV = Main development environment.
CI = Continues integration merge / build test environment.
TEST = Formal user testing environment.
The article “Force.com Architecture - CI” provides more detail regarding the specific environment setup and our Continuous Integration process.
The entire DevOps Automation developer experience is built around three stages:
Stage 1
Git Branch: feature or develop.
Automation: Standards Checks and Shared Asset Check.
Deploy Target: CI Sandbox.
Stage 2
Git Branch: User Specified.
Automation: Standards Checks, Shared Asset Check, Checkmarx, Unit Tests.
Deploy Target: TEST Sandbox.
Stage 3
Git Branch: master.
Automation: Standards Checks, Shared Asset Check, Checkmarx, Unit Tests and Approvals.
Deploy Target: PRD (via a FULL Sandbox which is used for PRD support).
Stage 1 is triggered automaticity every time a developer pushes code to a feature or develop branch in GitHub.
Stage 2 and 3 are triggered via Slack by messaging HUBOT:
Build <stage> for <project name> from <branch or commit>
The status of every stage, including any build failure information will be available instantly in Slack.
You will notice that each stage triggers different automation actions, this is to ensure that the automation does not impact the developer experience. For example, Checkmarx (Static Code Analysis) can take up to 10mins to complete, therefore this is only triggered at stage 2.
Finally, the only prerequisite from a code perspective is a valid “package.xml”, which includes the structure of the application. We also allow for a “partialPackage.xml” which enables development teams to push partial code into production.
The diagram below highlights the end-to-end developer experience.

Conclusion
Overall we are very proud of our Force.com DevOps Automation. I’ve spoken to many other enterprise Force.com customers and have yet to meet anyone with the same level of end-to-end automation and/or maturity.
More importantly, we achieved our goal of improving time to business value, agility, security, and quality, as well as providing complete autonomy to the development teams. All of this was achieved while maintaining the incredibly high standards required by a highly regulated industry.